
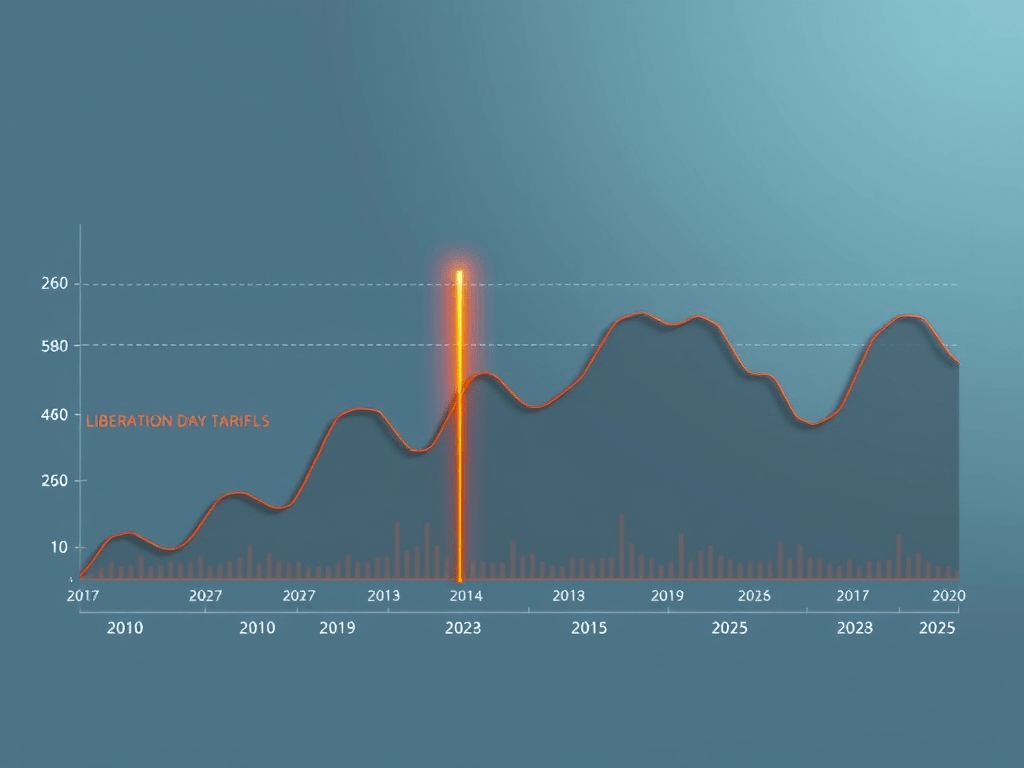
According to the Trend-Anomaly chart, after the liberation day tariffs, the U.S. Federal Budget Balance has recovered from the extremely high level deficit.

Source code:
library(tidyverse)
library(tidyquant)
library(timetk)

#U.S. Federal Budget Balance
df_us_balance <-
  read.delim("data/us_balance.txt") %>%
  as_tibble() %>%
  janitor::clean_names() %>%
  #removing parentheses and the text within
  mutate(release_date = str_remove(release_date, " \\(.*\\)"),
         actual = str_remove(actual, "B")) %>%
  mutate(release_date = parse_date(release_date, "%b %d, %Y")) %>%
  mutate(release_date = floor_date(release_date, "month") %m-% months(1),
         actual = as.numeric(actual)) %>%
  select(date = release_date, balance = actual) %>%
  drop_na()


#Anomaly Plot
df_us_balance %>%
  drop_na() %>%
  anomalize(date, balance) %>%
  plot_anomalies(date,
                 .line_size = 1,
                 .line_type = 1,
                 .interactive = FALSE,
                 .title = "<span style='color:dimgrey;'>Trend</span>-<span style= 'color:red;'>Anomaly</span> Chart<br>U.S. Federal Budget Balance") +
  geom_line(size = 0.2) +
  geom_vline(xintercept = as.Date("2025-04-02"),
             size = 1.2,
             linetype= "dashed",
             color = "darkorange") +
  scale_y_continuous(labels = scales::label_currency(suffix = "B")) +
  scale_x_date(expand = expansion(mult = c(.1, .1)),
               labels = scales::label_date("%Y")) +
  labs(subtitle = "<span style = 'color:darkorange;'>Liberation Day Tariffs</span>") +
  theme_minimal(base_family = "Roboto Slab", base_size = 15) +
  theme(legend.position = "none",
        panel.grid = element_blank(),
        axis.text = element_text(face = "bold"),
        #axis.text.x = element_text(angle = 60, hjust = 1, vjust = 1),
        plot.background = element_rect(fill = "azure", color = "azure"),
        panel.grid.major.x = element_line(linetype = "dashed", color = "gray"),
        panel.grid.major.y = element_line(linetype = "dashed", color = "gray"),
        plot.subtitle = ggtext::element_markdown(face = "bold", hjust = 0.5),
        plot.title = ggtext::element_markdown(face = "bold", hjust = 0.5))


Leave a reply to RS Tetrick Cancel reply