
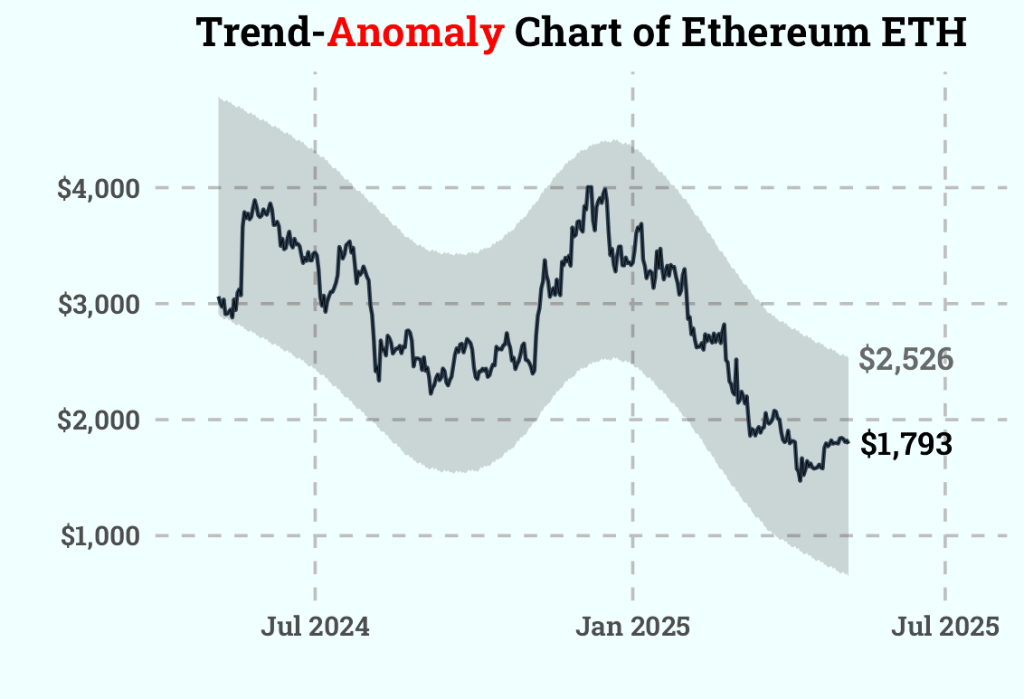
The Pectra upgrade for Ethereum could catalyze the expected uptrend despite the reduced risk appetite caused by the Tariff War between the US and China.
Based on the trend-anomaly analysis, this suggests the potential for a 40% increase in the near term.
library(tidyverse)
library(tidyquant)
library(timetk)

#Ethereum (ETH-USD)
df_eth <-
  tq_get("ETH-USD") %>%
  select(date, close)

#Anomaly Plot
df_eth %>%
  filter(date >= last(date) - months(12)) %>%
  anomalize(date, close) %>%
  plot_anomalies(date,
                 .line_size = 1,
                 .line_type = 1,
                 .interactive = FALSE,
                 .title = "Trend-<span style= 'color:red;'>Anomaly</span> Chart of Ethereum ETH") +
  ggrepel::geom_text_repel(
    data = . %>%  slice_tail(n = 1),
    aes(label = paste0("$",format(round(recomposed_l2, 0), big.mark = ",")),
        x= date,
        y = recomposed_l2),
    hjust = 1,
    vjust = .5,
    nudge_x = 0.5,
    fontface = "bold",
    family = "Roboto Slab",
    size = 6,
    color = "dimgray",
    segment.color = NA
  ) +
  ggrepel::geom_text_repel(
    data = . %>%  slice_tail(n = 1),
    aes(label = paste0("$",format(round(observed , 0), big.mark = ",")),
        x= date,
        y = observed),
    hjust = 1,
    vjust = .5,
    nudge_x = 0.5,
    fontface = "bold",
    family = "Roboto Slab",
    size = 6,
    color = "black",
    segment.color = NA
  ) +
  geom_line(size = 0.2) +
  scale_y_continuous(labels = scales::label_currency()) +
  scale_x_date(expand = expansion(mult = c(.1, .25)),
               labels = scales::label_date("%b %Y")) +
  theme_minimal(base_family = "Roboto Slab", base_size = 18) +
  theme(legend.position = "none",
        panel.grid = element_blank(),
        axis.text = element_text(face = "bold"),
        #axis.text.x = element_text(angle = 60, hjust = 1, vjust = 1),
        plot.background = element_rect(fill = "azure", color = "azure"),
        panel.grid.major.x = element_line(linetype = "dashed", color = "gray"),
        panel.grid.major.y = element_line(linetype = "dashed", color = "gray"),
        plot.title = ggtext::element_markdown(face = "bold", hjust = 0.5))



Leave a Reply