Ensembles of Models

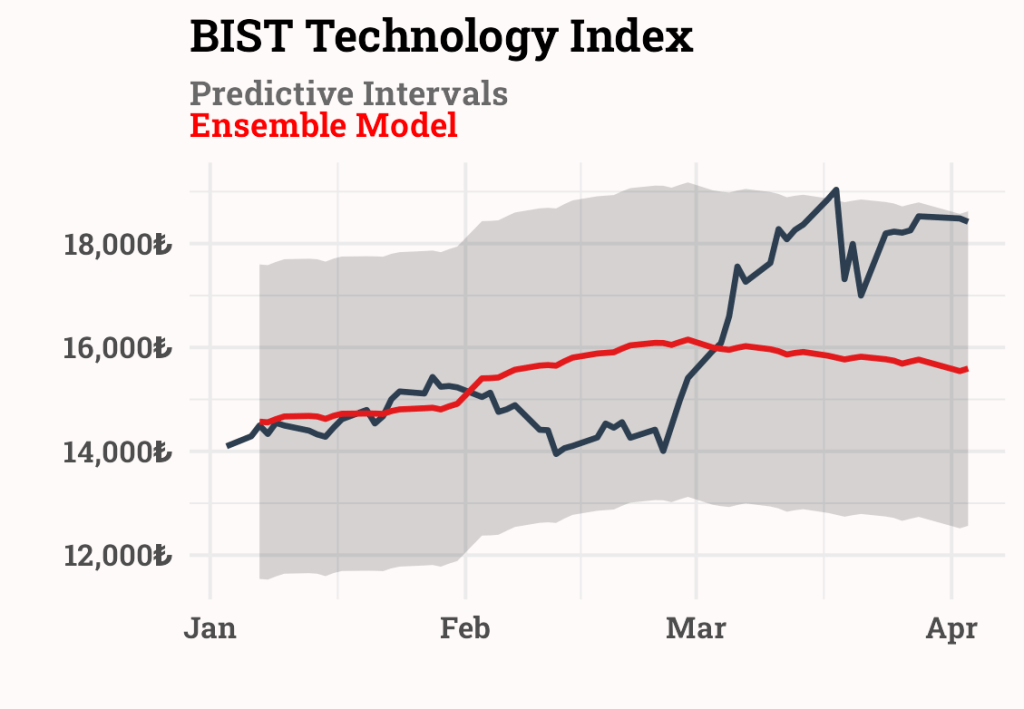
The BIST Technology index seems to have reached the upper band despite the ongoing political crisis in Turkey. But could it be continued?

Source code:

library(tidymodels)
library(tidyverse)
library(modeltime)
library(modeltime.ensemble)
library(timetk)

#BIST Technology Index
df_bist <- 
  read_csv("https://raw.githubusercontent.com/mesdi/investingcom/refs/heads/main/bist_tech.csv") %>% 
  janitor::clean_names() %>% 
  mutate(date = parse_date(date, "%m/%d/%Y")) %>% 
  select(date, value = price) %>% 
  slice_min(date, n = -1)


#Splitting
splits <- 
  time_series_split(df_bist, 
                    assess = "3 months", 
                    cumulative = TRUE)


#Recipe
recipe_spec <- 
  recipe(value ~ date, training(splits)) %>%
  step_timeseries_signature(date) %>%
  step_rm(matches("(.iso$)|(.xts$)")) %>%
  step_normalize(matches("(index.num$)|(_year$)")) %>%
  step_dummy(all_nominal()) %>%
  step_fourier(date, K = 1, period = 365)


#Model 1 - Auto ARIMA
model_spec_arima <- 
  arima_reg() %>%
  set_engine("auto_arima")

wflw_fit_arima <- 
  workflow() %>%
  add_model(model_spec_arima) %>%
  add_recipe(recipe_spec %>% step_rm(all_predictors(), -date)) %>%
  fit(training(splits))

#Model 2 - Prophet
model_spec_prophet <- 
  prophet_reg() %>%
  set_engine("prophet")

wflw_fit_prophet <- 
  workflow() %>%
  add_model(model_spec_prophet) %>%
  add_recipe(recipe_spec %>% step_rm(all_predictors(), -date)) %>%
  fit(training(splits))

#Model 3 - Elastic Net
model_spec_glmnet <- 
  linear_reg(
    mixture = 0.9,
    penalty = 4.36e-6
  ) %>%
  set_engine("glmnet")

wflw_fit_glmnet <- 
  workflow() %>%
  add_model(model_spec_glmnet) %>%
  add_recipe(recipe_spec %>% step_rm(date)) %>%
  fit(training(splits))

#Modeltime Workflow for Ensemble Forecasting
df_models <- 
  modeltime_table(
    wflw_fit_arima,
    wflw_fit_prophet,
    wflw_fit_glmnet
  )


#Make an Ensemble
ensemble_fit <- 
  df_models %>%
  ensemble_average(type = "mean")

#Calibration
calibration_tbl <- 
  modeltime_table(
    ensemble_fit
  ) %>%
  modeltime_calibrate(testing(splits))


#Accuracy
calibration_tbl %>%
  modeltime_accuracy() %>%
  table_modeltime_accuracy(
    .interactive = FALSE
  )


#Predictive intervals (95% Confidence Interval)
calibration_tbl %>%
  modeltime_forecast(actual_data = df_bist %>% 
                       filter(date >= last(date) - months(3)),
                     new_data = testing(splits)) %>%
  plot_modeltime_forecast(.interactive = FALSE,
                          .legend_show = FALSE,
                          .line_size = 1.5,
                          .color_lab = "",
                          .title = "BIST Technology Index") +
  labs(subtitle = "<span style = 'color:dimgrey;'>Predictive Intervals</span><br><span style = 'color:red;'>Ensemble Model</span>") + 
  scale_y_continuous(labels = scales::label_currency(prefix = "",suffix = "₺")) +
  theme_minimal(base_family = "Roboto Slab", base_size = 20) +
  theme(legend.position = "none",
        plot.background = element_rect(fill = "azure", 
                                       color = "azure"),
        plot.title = element_text(face = "bold"),
        axis.text = element_text(face = "bold"),
        #axis.text.x = element_text(angle = 60, hjust = 1, vjust = 1),
        plot.subtitle = ggtext::element_markdown(face = "bold", size = 20))

5 responses to “ Ensembles of Models”

  1. bitfool Avatar
    bitfool

    Hi, thanks for these posts, valuable for learning. The code for this post relies on “data/bist_tech.csv” for the data, and we don’t have it available. Can we use tq_get() to get the data some other way? If not, what is the data structure in the CSV so that I can build a test data set to try and run this code?

    Like

    1. Selcuk Disci Avatar

      Thank you for your kind words. I fixed the issue. You can check it now.

      Like

      1. bitfool Avatar
        bitfool

        Thanks! That works great now. I also have to remove the reference to ‘base_family = "Roboto Slab"‘ because it’s not present on my system, but then it just works.

        I also solved the issue myself by changing three lines in that first section:
        (1) tq_get(“^GSPC”) %>%
        (2) mutate(date = ymd(date)) %>%
        (3) select(date, value = close) %>%

        (1) to bring in a different data set
        (2) to read the date in YYYY-MM-DD format
        (3) to use the data’s “Close” column instead of “Price” in the original

        Thanks again!

        Liked by 1 person

  2. bitfool Avatar
    bitfool

    So, I’m new to the ML side of things, and the code isn’t terribly transparent. In short, I think this code: (1) brings in some price data, (2) runs several different regressions on the price data to generate predictions with uncertainty intervals, (3) combines them as an ensemble to make a single prediction, then (4) plots the prediction with uncertainty range. If that’s basically right, I don’t see exactly what it’s plotting… I tried changing the split parameter from “3 months” to a little longer and shorter, and the predictions change quite a bit, and I’m unclear as to why. Everything about it seems opaque… is the lookback range all the way to the beginning of the data set?

    If you could must another, similar post but use the article to talk about the various aspects of how things are actually working (and how to make alterations that might make sense), all applied to finance data sets like this, that would be wonderful and helpful. It’s lovely that with tidy_things we can have such compact code that does so much, but sometimes verbosity (and code comments) help make it more usable and extensible for others (or for ourselves when we come back to it after 6 months).

    And while I’m dreaming, another article where we add other features / columns / variables to the prediction to see if we can improve it… that would be wonderful too :-). In case you don’t have enough on your plate. Thanks again.

    Like

    1. Selcuk Disci Avatar

      I use ML models as an RSI (Relative Strength Index) to detect whether an index or stock is overbought or oversold.

      Liked by 1 person

Leave a comment

I’m Selcuk Disci

Welcome to DataGeeek.com, dedicated to data science and machine learning with R, mostly based on financial data.

Let’s connect