Skip to content
Search
Home
About
Contact
Tag:
datavisualization
CO2 Emissions Comparing and Modeling for Global Warming
Dynamic Regression with ARIMA Errors: The Students on the Streets
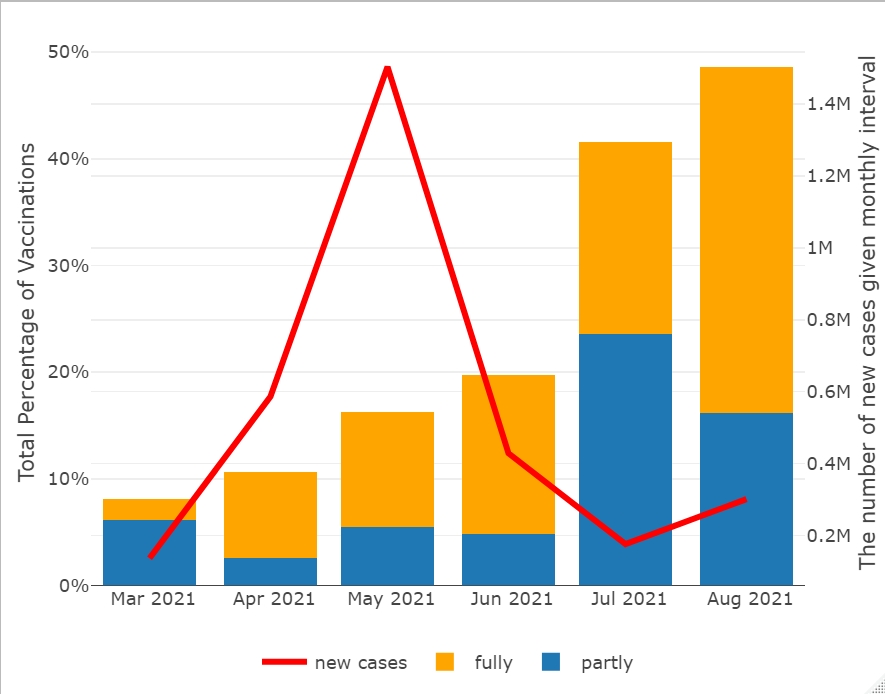
Plotly for Data Visualization: The Vaccinations Effect on Covid-19
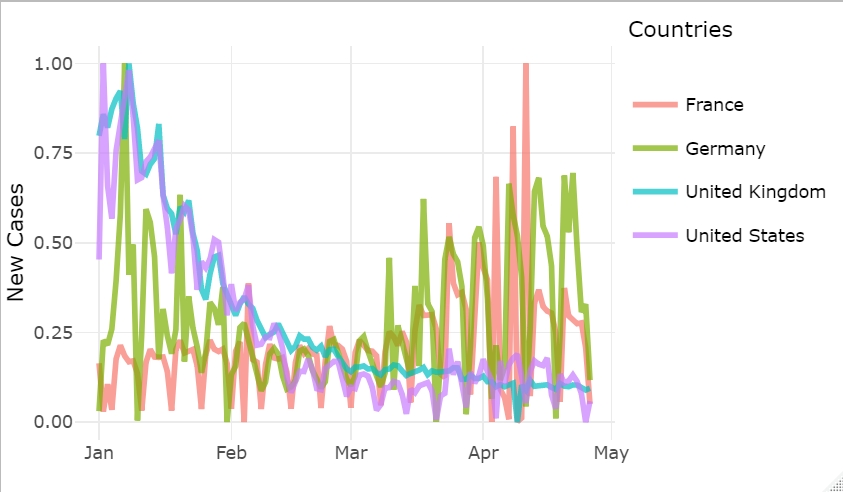
Comparing the Coronavirus Pandemic (COVID-19) Management for some Developed Countries
Subscribe
Subscribed
DataGeeek
Join 56 other subscribers
Sign me up
Already have a WordPress.com account?
Log in now.
DataGeeek
Subscribe
Subscribed
Sign up
Log in
Report this content
View site in Reader
Manage subscriptions
Collapse this bar