

LLM-enhanced momentum investing combines traditional momentum signals with real-time news interpretation by large language models (LLMs). The idea is straightforward: stocks with strong past returns are candidates for momentum portfolios, but their inclusion and weight are refined by LLM-generated sentiment scores derived from firm-specific news. This hybrid approach improves risk-adjusted returns (Sharpe, Sortino) and is particularly effective in concentrated, high-conviction portfolios.
Key Parameters
1. Lookback Window (k)
- Definition: The number of past days of news considered for sentiment analysis.
- Role: Determines how much recent information the LLM uses to judge momentum continuation.
- Example: If k = 5, the model analyzes the last 5 business days of headlines and summaries for each stock.
2. Forecast Horizon (l)
- Definition: The period over which momentum continuation is predicted.
- Role: Sets the “target” for the LLM’s forecast — how far into the future the model should judge momentum persistence.
- Example: If
l =5, the LLM predicts whether momentum will continue for the next 5 trading days. - Connection to Rebalancing: The forecast horizon typically aligns with the rebalancing cycle. For weekly rebalancing, the horizon is 5 days; for monthly rebalancing, it’s ~21 days.
3. Portfolio Size (m)
- Definition: The number of stocks selected after LLM scoring.
- Role: Controls how concentrated or diversified the portfolio is.
- Example: From the top 20 YTD performers, you might select the top 10 after sentiment scoring.
4. Rebalancing Frequency (T)
- Definition: How often the portfolio is updated with new signals.
- Role: Sets the rhythm of portfolio refresh — weekly, monthly, or quarterly.
- Example: Weekly rebalancing means recalculating momentum and sentiment scores every 5 trading days.
Concept
The strategy begins with a classic momentum screen: select the top 20 S&P 500 companies by year-to-date (YTD) performance. Instead of stopping there, the approach integrates large language model (LLM) sentiment analysis of firm-specific news. By analyzing the last 5 business days of headlines and summaries, the LLM produces a score indicating whether momentum is likely to continue.
These scores are then used to re-weight the portfolio, tilting allocations toward companies with stronger news sentiment. Finally, the portfolio is narrowed to the top 10 conviction stocks.
Selected Parameters
- Lookback Window: 5 days of firm-specific news.
- Rebalancing Frequency: Weekly updates of the portfolio.
- Forecast Horizon: 5 trading days (aligned with the rebalancing cycle).
This setup ensures that the LLM is asked to judge whether momentum will persist until the next rebalance, making the signals both short-term and actionable.
What the Code Does Step by Step
- Fetching the Data
- The R script first pulls all S&P 500 tickers.
- It calculates YTD returns for each stock.
- The top 20 stocks by performance are selected as momentum candidates.
- News Sentiment Analysis with LLM
- For each of these 20 stocks, the code queries Bing News for recent headlines with Azure AI Services.
- The last 5 business days of news are collected.
- These headlines and summaries are sent to a Microsoft Foundry-hosted LLM.
- The LLM outputs a score (0–1) indicating whether sentiment supports momentum continuation or signals reversal.
- Portfolio Tilting
- LLM scores are normalized to [-1, +1].
- Baseline equal weights are tilted according to these scores.
- The top 10 stocks by adjusted weight form the final portfolio
4. Visualization
- A styled table is created using the
gtpackage. - Adjusted weights are color-coded (red–green gradient).
- The final portfolio is saved as an image (
top10.png).
Strategic Insight
This approach mirrors the methodology in the Swiss Finance Institute paper:
- Momentum ranking provides the baseline.
- LLM sentiment scoring refines stock selection and weighting.
- Portfolio tilting integrates qualitative news signals into quantitative allocation.
library(httr)
library(jsonlite)
library(tidyquant)
library(tidyverse)
library(lubridate)
library(gt)
library(gtExtras)
library(scales)
library(showtext)
library(webshot2)

# 1. Environment & Auth Setup
sysfonts::font_add_google("Roboto Slab", "roboto_slab")
showtext_auto()

# Azure & Bing Credentials
bing_key           <- "<your-bing-key>"
bing_endpoint      <- "<your-bing-endpoint>"
azure_llm_key      <- "<your-llm-key>"
azure_llm_endpoint <- "<your-llm-endpoint>"

# R Part (first): S&P 500 Screening with Monthly Returns
sp500_tickers <-
  tq_index("SP500") %>%
  select(symbol, company)

# Calculate YTD change
momentum_df <-
  sp500_tickers %>%
  tq_get(get = "stock.prices", from = floor_date(today(), "year")) %>%
  group_by(symbol) %>%
  arrange(date) %>% # Ensure chronological order for first/last functions
  summarize(
    total_return = (last(adjusted) / first(adjusted)) - 1,
    .groups = "drop"
  ) %>%
  inner_join(sp500_tickers, by = "symbol") %>%
  slice_max(total_return, n = 20) %>%
  select(symbol, company)

# R Part (second): News Search and LLM Analysis
analyze_momentum_continuation <- function(ticker, company_name) {

  # Construct the Bing News Search query: ticker + ' stock'
  query_str <- paste0(ticker, " stock")
  news_url <- paste0(bing_endpoint, "v7.0/news/search")

  # Call Bing News Search API
  news_res <- GET(news_url, add_headers(`Ocp-Apim-Subscription-Key` = bing_key),
                  query = list(q = query_str, count = 5, freshness = "Day"))

  # Short pause to throttle calls and avoid rate limit errors
  Sys.sleep(1)

  news_text <- ""
  if (status_code(news_res) == 200) {
    content <- fromJSON(content(news_res, "text", encoding = "UTF-8"))
    if (length(content$value) > 0) {
      news_text <- paste(content$value$name, content$value$description, collapse = " | ")
    }
  }

  # Construct the LLM payload for Azure AI Foundry
  prompt_payload <- list(
    messages = list(
      list(role = "system", content = "You are an LLM Enhanced Momentum Investing Agent."),
      list(role = "user", content = paste0(
        "Headlines + Summaries for ", company_name, " (", ticker, "): ", news_text,
        "\nPerform sentiment analysis based on the last 5 days of news (lookback=5, horizon=5). ",
        "Infer whether sentiment supports momentum continuation or signals reversal. ",
        "Return a JSON object with two fields: 'subsector' (string) and 'llm_score' (string: probability 0-1)."))
    ),
    temperature = 0.1
  )

  llm_res <- POST(url = azure_llm_endpoint,
                  add_headers(`api-key` = azure_llm_key, `Content-Type` = "application/json"),
                  body = prompt_payload, encode = "json")

  if (status_code(llm_res) == 200) {
    llm_out <- fromJSON(content(llm_res, "text", encoding = "UTF-8"))
    # Parse JSON response without using regex
    llm_json_data <- fromJSON(llm_out$choices$message$content)
    return(as.data.frame(llm_json_data))
  } else {
    return(data.frame(subsector = "N/A", llm_score = "0.5"))
  }
}

# Execute Analysis: Merge top 20 tickers with LLM scores
news_scores_df <- momentum_df %>%
  mutate(analysis = map2(symbol, company, analyze_momentum_continuation)) %>%
  unnest(analysis) %>%
  mutate(llm_score = as.numeric(llm_score))

# R Part (final): Portfolio Tilting and Visualization
# Normalize scores to [-1, +1] and tilt weights
tilted_portfolio <- news_scores_df %>%
  mutate(
    norm_score = rescale(llm_score, to = c(-1, 1), from = c(0, 1)),
    base_weight = 1 / n(),
    adj_weight = base_weight * (1 + norm_score)
  ) %>%
  mutate(adj_weight = adj_weight / sum(adj_weight)) %>%
  slice_max(adj_weight, n = 10)

# Create gt visualization using original column names
final_table <- tilted_portfolio %>%
  select(company, subsector, adj_weight) %>%
  gt() %>%
  tab_header(title = "Top 10 Tilted S&P 500 Momentum Stocks") %>%
  # Use cols_label for human-readable labels without renaming underlying columns
  cols_label(
    company = "Company",
    subsector = "Subsector",
    adj_weight = "Adjusted Weight "
  ) %>%
  # Apply color intensity with scales::col_numeric
  data_color(
    columns = adj_weight,
    colors = col_numeric(palette = c("red", "green"), domain = NULL)
  ) %>%
  fmt_percent(
    columns = contains("adj_weight"),
    decimals = 2,
    locale = "en"
  ) %>%
  cols_align(align = "center") %>%
  opt_table_font(font = google_font("Roboto Slab"))

# Save the visualization as top10.png using webshot
gtsave(final_table, "top10.png")
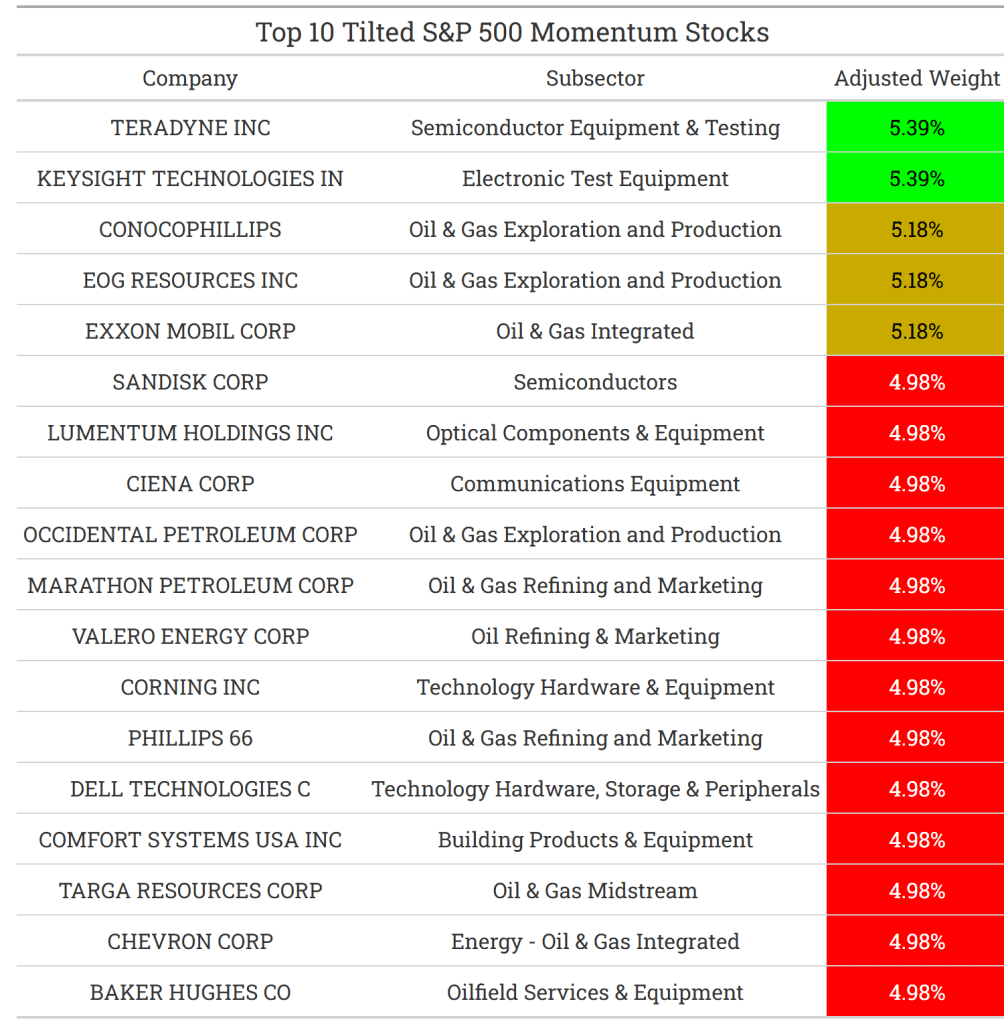
Final Observation
Looking at the resulting portfolio, one striking feature is the dominance of energy and petroleum companies. Firms such as ConocoPhillips, EOG Resources, ExxonMobil, Occidental Petroleum, Marathon Petroleum, Valero, Phillips 66, Chevron, and Baker Hughes all appear prominently.
This heavy tilt toward energy is not random—it reflects how geopolitical tensions (Iran and U.S.–Israel war dynamics) have amplified the importance of oil and gas in global markets. News sentiment around these companies has been strongly supportive of continued momentum, pushing them into the top allocation slots.


Leave a comment