

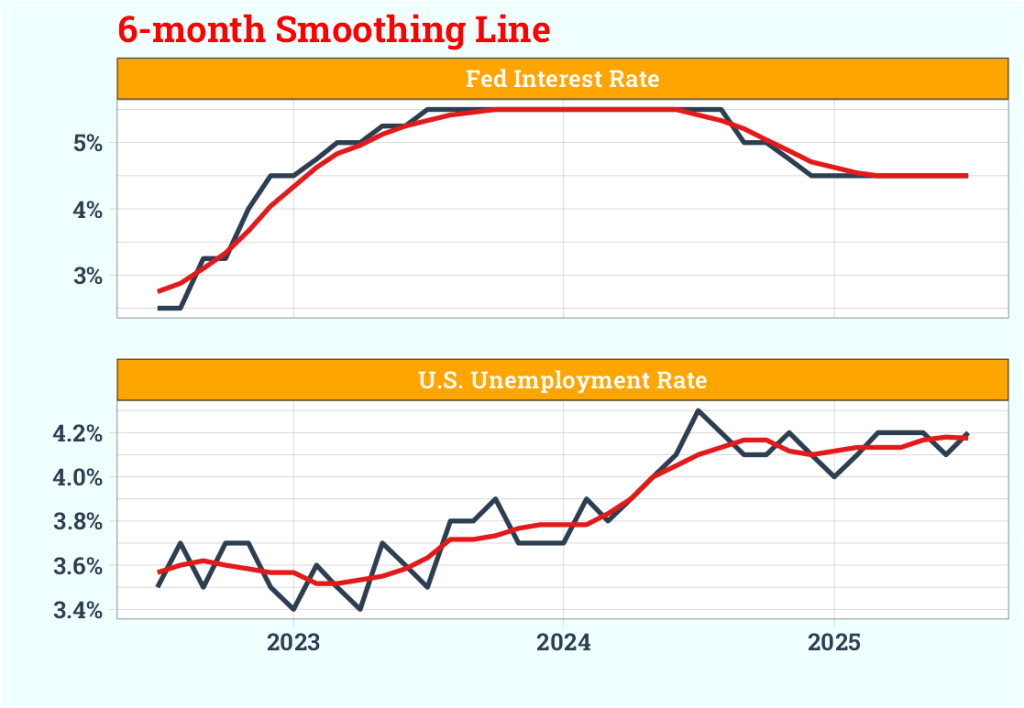
Bank of America cautioned that the Federal Reserve risks making a policy error if it starts cutting rates next month.
They indicated that economic activity has increased after a slowdown in the first half of the year, and if that is accurate, the labor market is likely to recover as well.
The rolling mean chart shows rate cuts came after the significant uptrend of unemployment, and we can not see such a that increasing recently.
Source code:
library(tidyverse)
library(timetk)

#U.S. Unemployment Rate
df_unemployment <-
  read.delim("https://raw.githubusercontent.com/mesdi/blog/refs/heads/main/unemployment") %>%
  as_tibble() %>%
  janitor::clean_names() %>%
  #removing parentheses and the text within
  mutate(release_date = str_remove(release_date, " \\(.*\\)"),
         actual = str_remove(actual, "%")) %>%
  mutate(release_date = parse_date(release_date, "%b %d, %Y")) %>%
  mutate(release_date = floor_date(release_date, "month") %m-% months(1),
         actual = as.numeric(actual)) %>%
  select(date = release_date, 'U.S. Unemployment Rate' = actual) %>%
  drop_na()


#Fed Interest Rate
df_fed_rates <-
  read.delim("https://raw.githubusercontent.com/mesdi/blog/refs/heads/main/fed_rates.txt") %>%
  as_tibble() %>%
  janitor::clean_names() %>%
  #removing parentheses and the text within
  mutate(release_date = str_remove(release_date, " \\(.*\\)"),
         actual = str_remove(actual, "%")) %>%
  mutate(release_date = parse_date(release_date, "%b %d, %Y")) %>%
  mutate(release_date = floor_date(release_date, "month"),
         actual = as.numeric(actual)) %>%
  select(date = release_date, 'Fed Interest Rate' = actual) %>%
  #makes regular time series by filling the time gaps
  pad_by_time(date, .by = "month") %>%
  fill('Fed Interest Rate', .direction = "down") %>%
  drop_na()

#Survey data
df_survey <-
  df_unemployment %>%
  left_join(df_fed_rates) %>%
  drop_na() %>%
  pivot_longer(2:3,
               names_to = "symbol",
               values_to = "value")

#Sliding (Rolling) Calculations
# Make the rolling function
roll_avg_6 <-
  slidify(.f = mean,
          .period = 6,
          .align = "center",
          .partial = TRUE)

# Apply the rolling function
df_survey %>%
  select(symbol,
         date,
         value) %>%
  group_by(symbol) %>%
  # Apply Sliding Function
  mutate(rolling_avg_6 = roll_avg_6(value)) %>%
  tidyr::pivot_longer(cols = c(value, rolling_avg_6)) %>%
  plot_time_series(date,
                   value/100,
                   .color_var = name,
                   .line_size = 1.2,
                   .facet_ncol = 1,
                   .smooth = FALSE,
                   .interactive = FALSE) +
  labs(title = "<span style = 'color:red;'>6-month Smoothing Line</span>",
       y = "",
       x = "") +
  scale_y_continuous(labels = scales::percent_format()) +
  theme_tq(base_family = "Roboto Slab", base_size = 16) +
  theme(plot.title = ggtext::element_markdown(face = "bold"),
        plot.background = element_rect(fill = "azure"),
        strip.text = element_text(face = "bold", color = "snow"),
        strip.background = element_rect(fill =  "orange"),
        axis.text = element_text(face = "bold"),
        legend.position = "none")


Leave a comment